How Social Media and Mobile Technology Impact the Customer Experience [Infographic]

It’s easy for technology start-ups and web service companies to understand the importance of communicating with customers through channels such as social media and mobile technology. They have it ingrained in their DNA. It’s more difficult for companies that have a long-standing culture of face to face or direct mail interaction, to adopt these methods.

It’s not that face to face interaction with customers is unimportant. I believe that it is still the single best method for building relationships and getting a true understanding of your customers’ needs. The problem is that it takes time and your customers aren’t always willing to give it. With a myriad of choices, customers opt for the quickest and most painless way of learning, providing feedback, complimenting, or complaining.

Avaya, a global provider of business collaboration and communications solutions, has created the infographic below titled “How Social Media and Mobile Technology Impact the Customer Experience.” This great research identifies and ranks the channels that consumers prefer when interacting with brands.

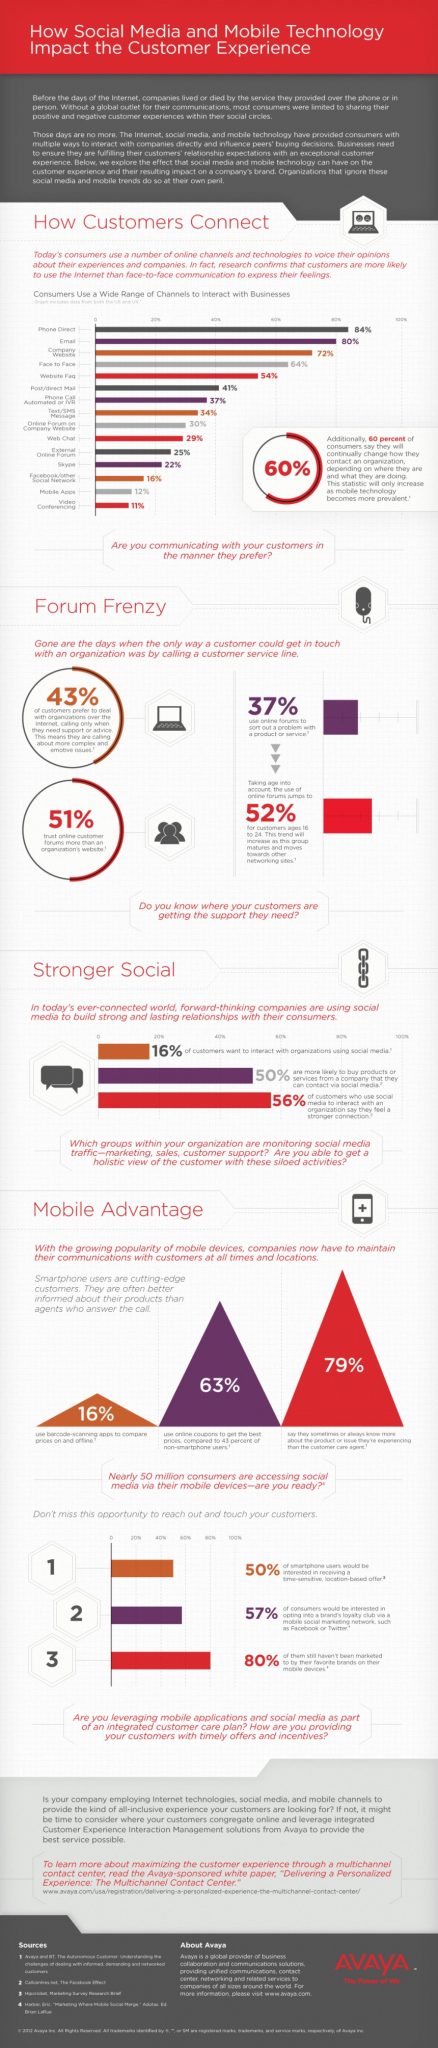
Preferred Channels to Interact with Businesses (in order of most preferred to least preferred)

  • Phone Direct - 84%
  • Email - 80%
  • Company Website - 72%
  • Face to Face - 64%
  • Website FAQ - 54%
  • Post/direct Mail - 41%
  • Phone Call - 37%
  • Text/SMS - 34%
  • Company Online Forum - 30%
  • Web Chat - 29%
  • External Online Forum - 25%
  • Skype - 22%
  • Facebook/Other Social Network - 16%
  • Mobile Apps - 12%
  • Video Conferencing 11%

If you’re a business owner or brand marketer, it’s important to recognize that your customers have a preference to how they’d like to engage with you. Are you adopting the right channels?

How Social Media and Mobile Technology Impact the Customer Experience Infographic:

How Social Media and Mobile Technology Impact the Customer Experience

Infographic by: Avaya

The History of Marketing [Infographic]

If you’re looking for a quick and easy Marketing 100 class then look no further than this great infographic created by HubSpot and designed by BlueGlass.

Quick summary:

It’s amazing to see how marketing has transformed over the years and even more impressive is the rate in which a single message is distributed instantly to millions or billions of people. Starting with mass printing, the infographic moves you through the different mediums of posters, magazines, newspapers, and billboards. In 1922 radio advertising kicks in, followed a few decades later by television commercials in 1941. With the rise of telephones in most American’s homes, telemarketing becomes a common tactic. New technologies give rise to new means of communications with the personal computers and mobile phones but older mediums such as newspaper advertising still dominates. It’s not until 1990s that television overtakes newspapers as the largest ad spend. SMS messaging on mobile phones gets introduced in 1992 and twenty years later is still at it’s infancy. Internet advertising spikes in 1995-2002 as the dot-com bubble grows. Search engines jump onto the scene in 1995 and 1997. Do you remember AltaVista? Anyone? Search engine optimization (SEO) naturally follows, mostly defined by keyword stuffing and other on-page tweaks.  Google launches in 1998 and launches paid search marketing through Adwords. Blogging comes onto the scene in 1998 just before the bubble bursts in 2000. Email marketing becomes heavily abused by spammers and in 2003 the CAN-SPAM act is passed into law. Social media spreads in 2003 and 2004 with Myspace, LinkedIn, and Facebook. SEO becomes a common key-phrase claimed by every webmaster and developer in 2005 and on. Twitter launches in 2007 and doesn’t stop growing. Email marketing struggles to push through the spam filters and text message marketing begins to take shape. The shift starts to happen from batch blasts to creating valuable content that drives people to your business. Google launches G+ and continues to adjust it’s algorithm in 2011. Mobile, tablets, and hand-held devices are skyrocketing as computer towers and laptops sales drop. E-commerce becomes more personalized and marketers are able to target smarter and faster. According to the infographic online shoppers will reach 184.3 million, up 3.3% from 2011. What do you think will come next?

The History of Marketing

From: HubSpot Marketing Software