2013 B2B Marketing Priorities [Study]

Towards the end of 2012, Software Advice, CMO.com, and Eloqua teamed up to ask marketing professionals their priorities in 2013.The study titled B2B Demand Generation Benchmark Survey, gives marketers a complete view of the current status of the marketing sphere as well as a look at what’s to come.

Compiled by Software Advice CRM Analyst Ashley Verrill, the survey results show all the most popular marketing channels, as well as a breakdown of that information such as the channels that bring in the highest quality leads, the highest quantity leads, and the costs involved with these channels. Other results include the effectiveness of using marketing automation technology and how much companies plan to spend on marketing in 2013.

Below are some of the most interesting findings…

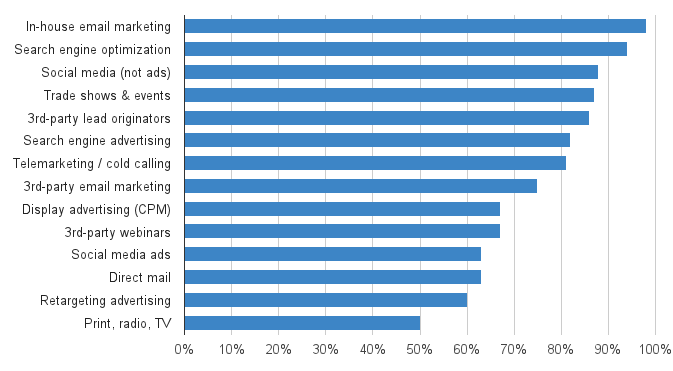
Digital Channels Have Become Top Priority for Marketers

The graph below illustrates the percentage of marketing respondents that use each channel for demand generation.

Percent of Respondents Using Each Channel

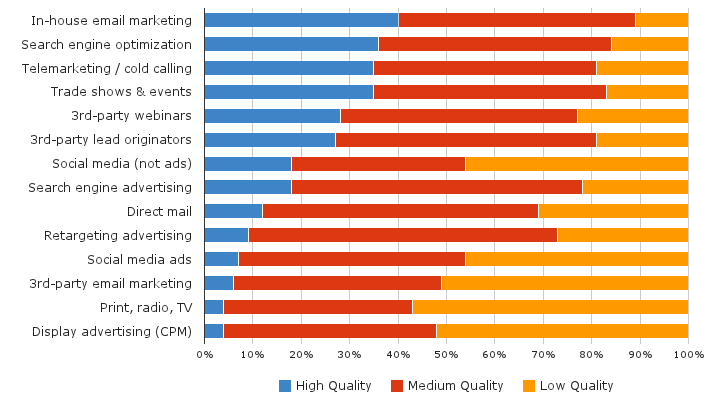
Email Marketing Generates the Highest Quality Leads

The chart below is ranked from highest to lowest percentage of marketers identifying the channel as producing high quality leads.
Opinions of Lead Quality by Channel

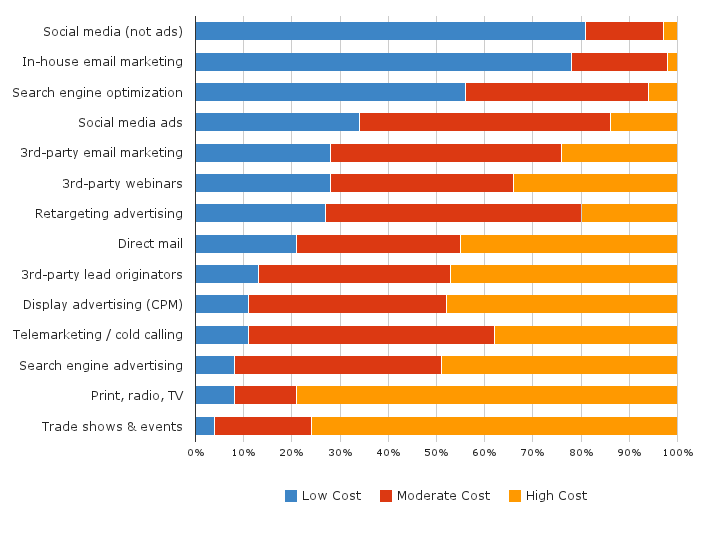
Social Media is the Least Expensive Lead Generation Channel

The chart below is ranked from highest to lowest percentage of marketers identifying the channel as low cost-per-lead.
Opinions of Lead Cost by Channel

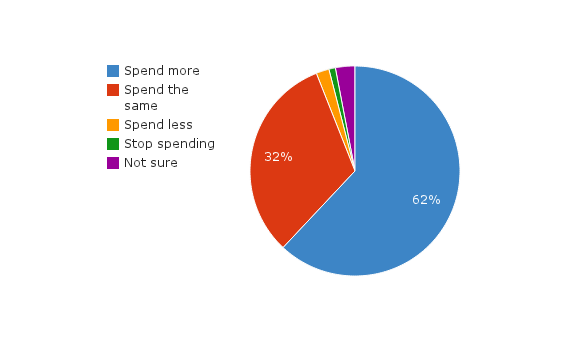
Marketers Have Planned to Spend More in 2013 than 2012

The chart below shows how marketers will adjust their spending plans relative to what they allocated for programs in 2012.
Overall Demand Generation Spend Plans Next Fiscal Year

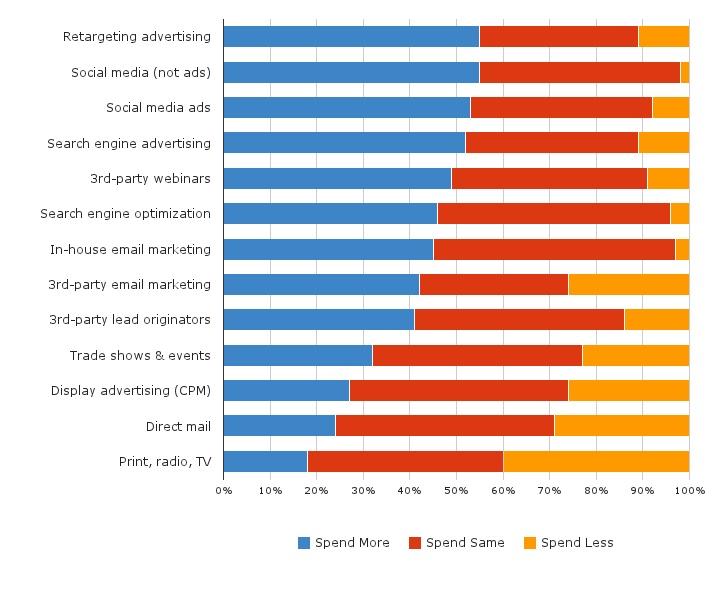
Marketers Have Planned to Spend in Social Media and Retargeting

The chart below reveals how marketers will adjust their spending plans by channel in 2013 relative to 2012.
Demand Generation Spend Plans by Channel Next Fiscal Year

Special thank you to Holly Aker for helping me compile the content in this post.

The Rise of Real-Time Bidding. Is Your Business Behind?

Below is a guest post by Aubree Parsons, a bright and energetic writer/journalist focused on many topics including marketing.

John Wanamaker, one of the pioneers in advertising and marketing in the United States, once commented with no small amount of tongue in his cheek:

“Half the money I spend on advertising is wasted; the trouble is I don’t know which half.”

When billboards and television commercials were the main sources of advertising, it was impossible to tell how influential each individual ad was on consumers – which produced the results, and which were totally wasted.

Such has been the plight of businesses, great and small, around the world until direct-response marketing changed everything.

The rise of consumer data and targeted advertising online completely flops this kind of thinking on its head. Now, it is possible to follow individual clicks from the ads a company posts around the web, and one day, it may even be possible to directly trace traffic from ad source to purchase.

The new, advanced, and developing world of real-time bidding is a big step toward this bright future. For those who remain unfamiliar with the term, real-time bidding (RTB) allows businesses to select consumer criteria and a bidding price for each impression. Online ad companies then communicate bid price over their network, placing the business’ ad where its bid wins the contest. Think AdWords but taken to visual ads that are placed strategically on high-traffic websites – the billboards of the Web’s superhighway.

Since the preliminary data from Facebook Exchange hit the streets last month (“Facebook Partners Say Exchange Increased Ad ROI By Up to 20X”), small businesses have taken a new interest in real-time bidding. That is good news, because these new, targeted ads have the potential to improve online ad markets and continue to shift the advertising game online.

The bad news is, the increased traffic will also increase prices. Businesspeople should get in on real-time bidding now and learn how to maximize their ROI.

There is not currently a completely precise way to evaluate the return on RTB advertising, but there are a few strategies and applications, which can help.

Let’s start with a basic formula:

Site traffic (unique visitors) * purchases/visitor * average profit per purchase = profits from web site

Only businesses can supply this data from their own web analytics software. If you don’t know how many consumers are bouncing off your landing pages versus purchasing your products or signing up for your newsletter, then you’re stuck. Install some web analytics software.

The rest of the data needed for calculations (the number of visitors per ad, and the price of each ad) will depend on the ad company you choose. For instance, AdRoll will either provide basic data (average order value) or more advanced features that provide conversion ratios. In order to be precise, businesses need to know the conversion ratios.

In order to avoid the more nuanced calculations, a business can always estimate the success of its advertising by playing with the amount it spends and by tracking its profits from week-to-week, or month-to-month. However, this generalized system does not take full advantage of the RTB system and will not lead to better ad campaigns in the future.

How to Improve Google Adwords Quality Scores [Infographic]

I recently stumbled upon an useful infographic created by Digital Net Agency, a performance-based search agency with a concentration on Search Engine Optimization (SEO) and Search Engine Marketing (SEM). The infographic provides great insight into one of the most important aspects of paid search advertising, the Google Adwords Quality Score.

The Quality Score is essential for digital marketers to understand because it helps determine how much you have to pay to receive a position in the “sponsored” area of the search engine results page. You can optimize your Quality Score to receive a higher position for a lower bid that your competitors. Said another way, you’ll pay less money for more clicks and visibility. Therefore, it is important to understand and measure.

Quick summary of Google Adwords Quality Score factors:

  • Click-through rate (CTR)
  • Relative (CTR)
  • Landing-page quality
  • Keyword/search relevance
  • Ad/site Performance
  • Display URLs past CTR
  • Account history
  • Keyword/ad relevance
  • Geographic performance
  • Targeted devices

Focus on your “kewords, ads, and landing-page relevancy” and you can improve your Google Adwords Quality Score.

How to Improve Google Adwords Quality Scores Infographic:

Improve Google Quality Score Infographic

Source: DigitalNetAgency.com

Track Your Marketing with a Campaign ID

As marketers, we’ve all heard John Wanamaker’s famous quote…

“Half the money I spend on advertising is wasted; the trouble is I don’t know which half.”

The reason that this quote is so popular is because it resonates very well with business owners, entrepreneurs, and advertisers. It turns out to be fairly true due to the fact that many people don’t or don’t know how to set up their campaigns efficiently.

Agencies and marketing employees continuously attempt to justify their advertising budgets but they end up using buzz words like “awareness”, “frequency”, and “reach.” Although these are important concepts, the truth is they pop up because of a lack of insight into the true number of conversions. This is especially true for complex industries where a product is sold through multiple third parties or for long purchase cycles with many prospect touch points.

So what do you do?

One idea is leveraging the power of the Campaign ID. By Campaign ID, I’m talking about the “Lead Source” or where the customer, account, or prospect came from. If you have multiple touch points, it may be advantageous to track multiple Campaign IDs or create rules such as first/last Campaign ID attached to that lead wins. The important part is that you know where your customers and prospects are coming from and attributing their transactions with their related marketing campaigns.

The way to accomplish this is to store your Campaign ID inside of your customer relationship database (CRM). At the time of entering that contact, whether via a sales rep or an online registration form, you must pass the “Campaign ID” into a field in the database. It’s easy to accomplish this online but also possible through in-store sales, tracked phone calls, and traditional advertising. You just have to always ask “How did you hear about us?” or “Have you seen any of our marketing lately?” When you get the answer, be consistent and add your Campaign ID to that customer.

What can you track with a campaign ID?

  • Paid Search
  • Display Advertising
  • Social Media
  • Webinars
  • Phone Calls
  • Billboards
  • Magazines
  • Newspapers
  • Television

For some of the more traditional advertising such as billboards, magazines, newspapers, and television you’ll need to develop a strong call-to-action (CTA) that drives people either online or to call a phone number. Make the phone number unique for each campaign and measure your conversion rate. How many people called the number and became customers? Compare that with some of your other campaigns and you’ll begin to see where you can spend your advertising dollars the most efficiently.

Brand awareness is import. If your prospects don’t remember your brand or recognize who you are then they likely won’t become customers anytime soon. That being said, it’s also important to be driving towards advertising that is efficient, measurable, and sales centered. Focus less on the impressions/views and more on the engagements that are further down the purchase funnel. That is the goal of utilizing the campaign ID.

How People Spend Their Time Online [Infographic]

Originally posted by Go-Golf.com, a Dubai Web Design and Web Application Development Company. The entire post was valuable so it has been shared in full below. Thanks Go-Golf.com!

Did you Know

Global Online Population of 2,095,006,005 equals 30% of World’s Population.

Global Time Spent Online Per Month is 35,000,000,000 hours (35 Billion) which is equivalent to 3,995,444 years

US Internet user on average spends 32 hours on internet per month. This is double than the time spent by Global Internet user i.e. 16 hours per month.

Asia has the highest online population of 922,329,554 online users whereas North America has the highest online penetration rate of 78.90%

China has the highest number of Internet users 456,238,464 i.e 34.30% of its total population

Social networking is the most time consuming activity for an Internet user. A normal Internet user spends around 22% of its time on social networking sites, 21% on searches, 20% on reading content, 19% on emails and communication, 13% on multimedia sites and 5% on online shopping

92% of Internet users have used Internet for sending e-mails and for using search engines. 83% for getting more information related to health or hobbies. 82% for searching directions. 81% for getting weather information.78% for information on new products. 76% for reading news. 72% for entertainment and 71% for online shopping.

Google is the most visited web property online. Whereas, Facebook is the biggest time. A normal Facebook users spends around 7 hours, 45 minutes and 49 seconds per month on Facebook.

Some more Interesting Facts

More than 56% of Social Networking Users have used Social Networking Sites for spying on their partners.

Brazilians have the highest online friends averaging 481 friends per user, whereas Japanese have the least average of only 29 friends.

Chinese users spend the maximum time of more than 5 hours a week,in shopping online.

More than 1 Billion Search Queries per day on Google.

4 Billion views per day on Video Sharing Website YouTube. (Social Networking site)

Video content of more than 60 hours gets uploaded every minute onto YouTube.

More than 250 Million Tweets per day.

More than 800 Million updates on Facebook per day.

Location best services and Time Shifted TV will be the most popular trends of future with growth rate of 27% followed by Internet Banking growing at 19% per year.

How People Spend Their Time Online
Infographic by- GO-Gulf.com Dubai Web Design Company